Calculation Spellchecker for Excel
Check results, find spreadsheet mistakes, use research functions and run R, all inside Excel. No AI, just verify.
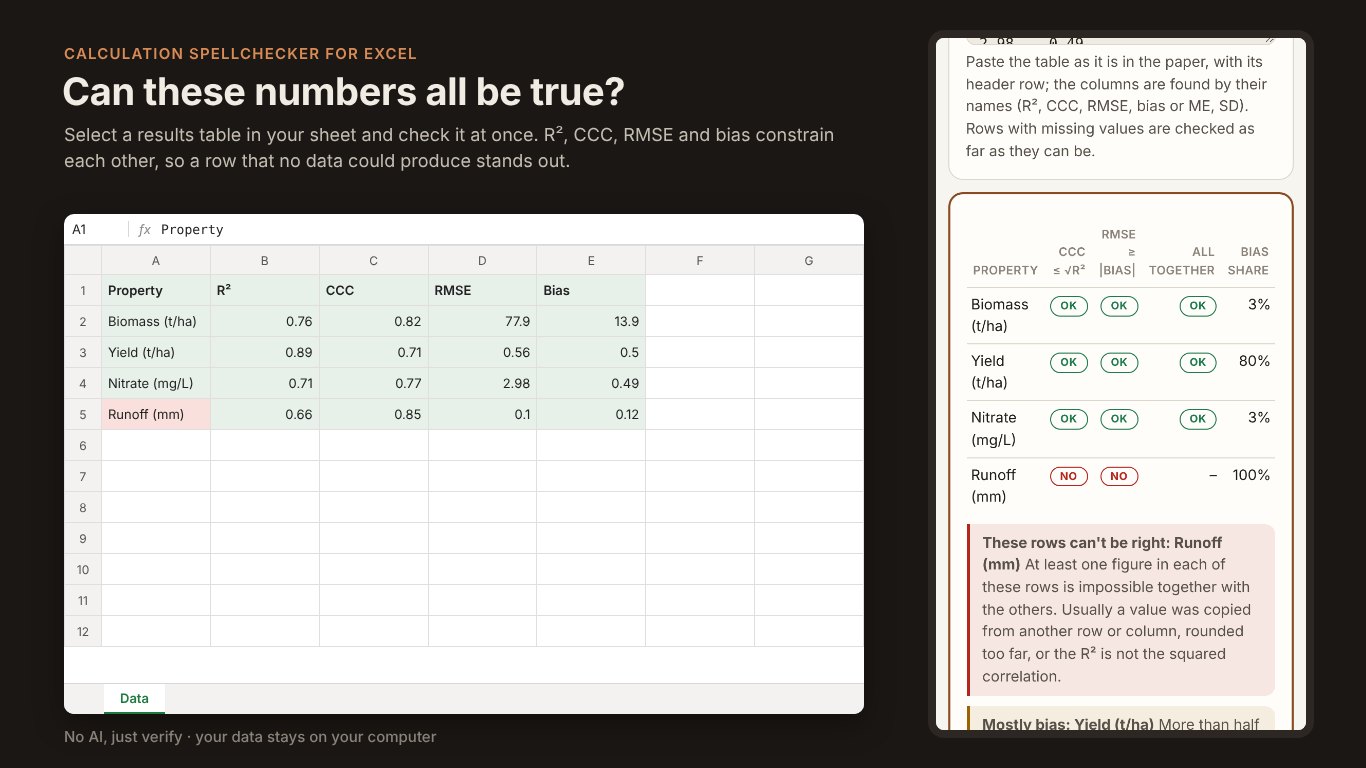
Calculation Spellchecker checks numbers the way a spellchecker checks words. Select cells and it tells you whether the results hang together, finds mistakes in the spreadsheet itself, and brings R into the workbook. Everything runs on your computer; your data stays there.
What it does
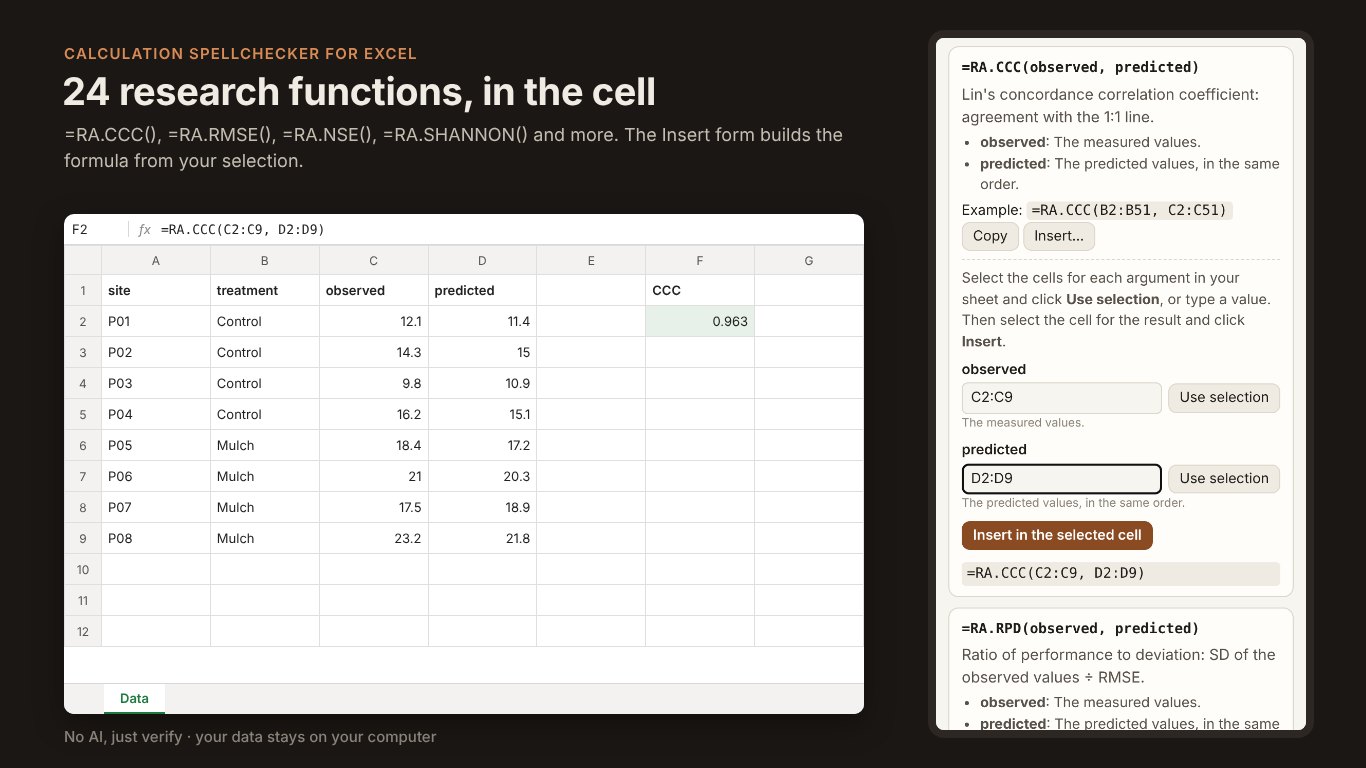
=RA.CCC(), =RA.RMSE() and more, with an Insert form that builds the formula.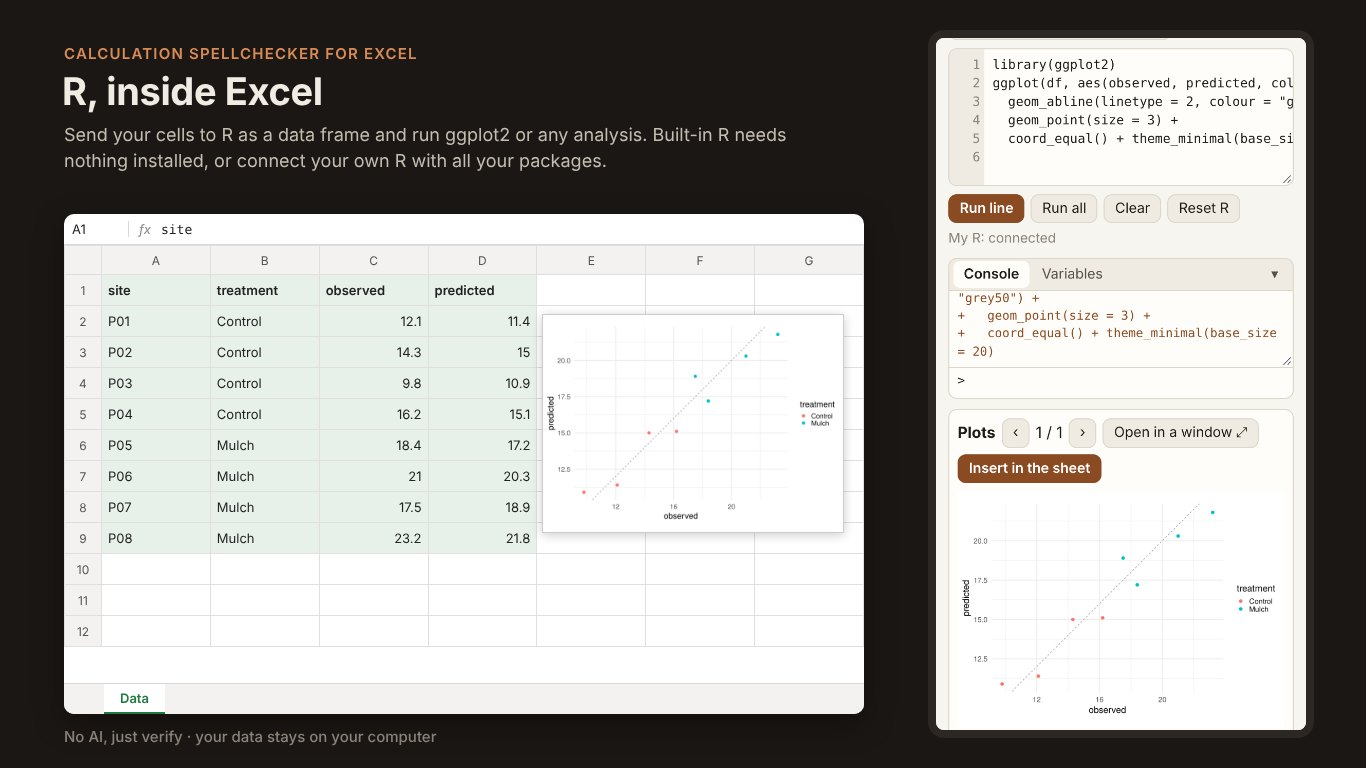
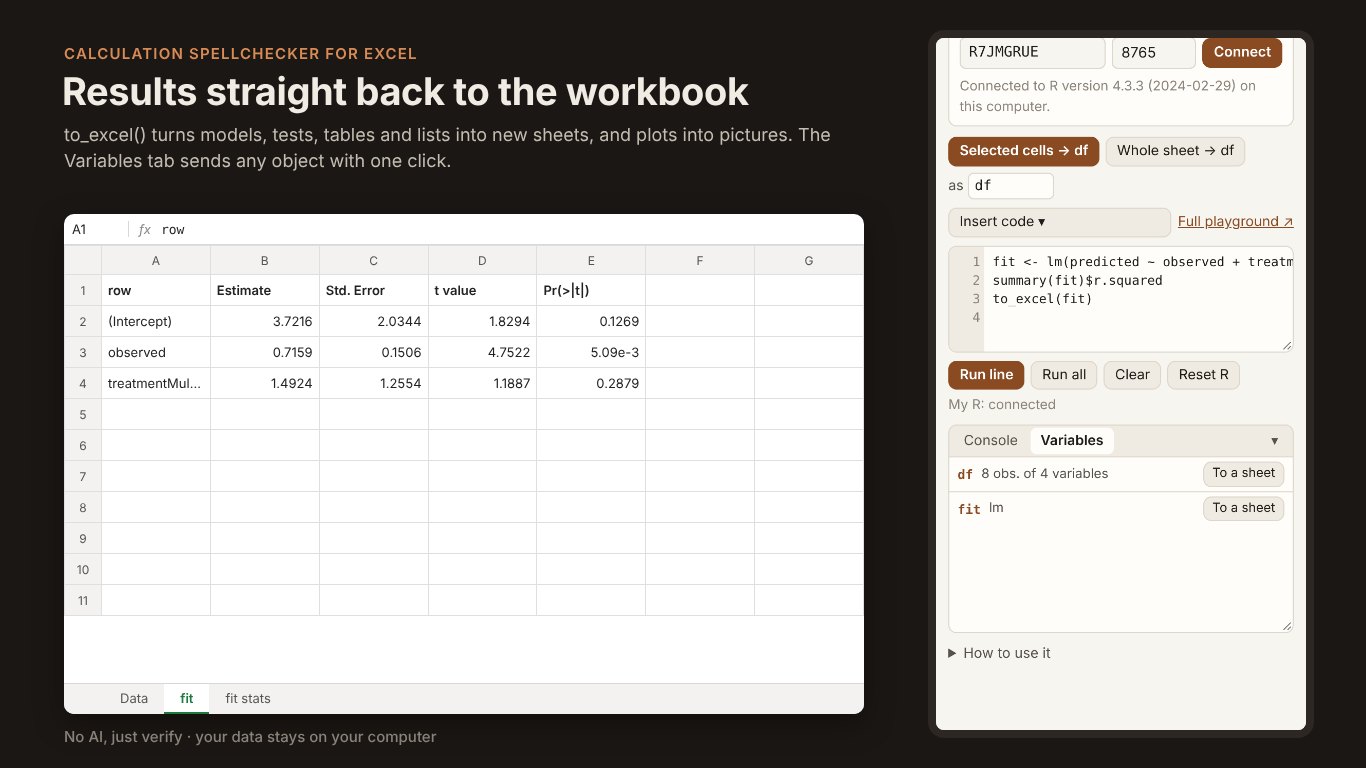
to_excel() turns models, tests, tables and lists into new sheets, and plots into pictures.Free, and with a licence
Free
Always free, for anyone
- Every plausibility check, with values you type or paste
- Plots and worked calculations
With a licence
All add-ins: $20 a year, $15 for members, free for contributors
- Checks on your cells: select a table or values and check them; check the whole workbook; add findings as cell comments; write results to a sheet
- Spreadsheet checks: formula mistakes and impossible values
- Research tools from this website, using your cells and writing to new sheets
- Cell functions: all 24
=RA.functions - R in Excel: built-in, or connected to your own R
In detail
Plausibility checks. The checks from Check a result read your selected cells: whether R² and RMSE fit the spread of the data, whether R², CCC, RMSE and bias can all be true, whether a kriging error fits its variogram, whether a carbon stock adds up, and more.
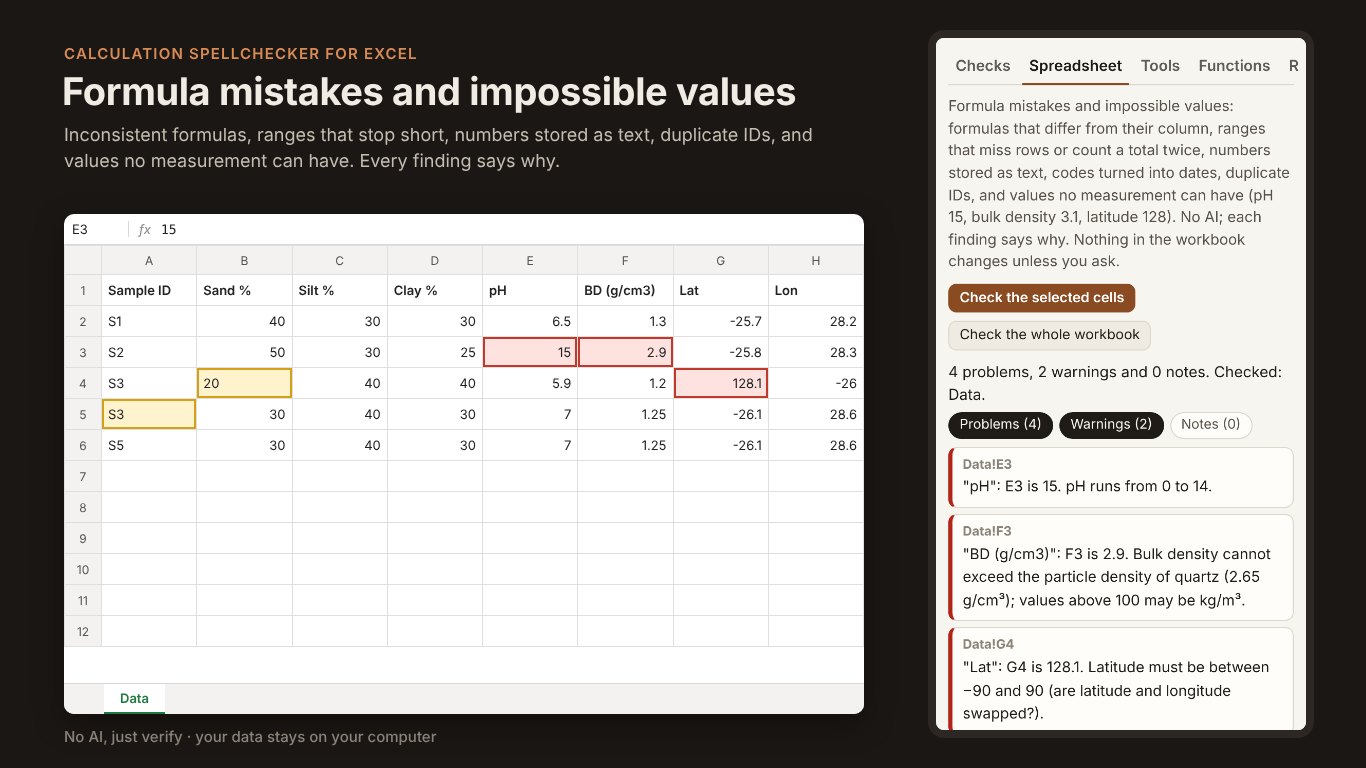
Spreadsheet checks. Formula errors, a formula that differs from the rest of its column, numbers typed over formulas, SUM and AVERAGE ranges that stop short or count a total twice, numbers stored as text, codes Excel turned into dates, duplicate IDs, gaps, and values no measurement can have (pH 15, a bulk density above that of quartz, latitude and longitude swapped, fractions that add up to more than 100%). Nothing in the workbook changes unless you ask.
Research tools. The tools on this website, in Excel: they take your selected cells and write their results to new sheets or insert their charts.
Cell functions. Model agreement (RMSE, MAE, BIAS, R2, NSE, CCC, RPD, RPIQ, MINRMSE), diversity (SHANNON, SIMPSON, EVENNESS, RICHNESS), water retention (VG_THETA, VG_K), daylength, radiation and evapotranspiration, carbon stocks, texture classes, depth splines, back-transformation, sample size and distances. The Functions tab explains each one and inserts it for you.
R in Excel. The selected cells or the whole sheet become a data frame in R. Run any R code; to_excel() sends tables, model results, tests and lists to new sheets and ggplots as pictures, and each plot opens in a window where you can resize it and redraw it at print resolution. The Variables tab lists what is in R’s workspace. R runs inside the panel with nothing to install, or connects to your own R so you can use your own packages and functions.
Good to know
- Needs: current Excel: Microsoft 365, Excel 2021 or later, Excel on a Mac, or Excel on the web.
- Languages: English, Kiswahili and Spanish.
- User guide: how to install, open and use each tab, in a 3-page PDF.
- Private: everything runs on your computer; only a licence key is checked with our members service. See the privacy policy.
- How to cite: Flynn, T. (2026). Check a result for Excel: plausibility checks for research results [Excel add-in]. RafikiArdhi. https://doi.org/10.5281/zenodo.23898323